
Stop Measuring ATT&CK Coverage.
Start Tracking Adversary Campaigns.

If your ATT&CK dashboard can tell you that “Credential Access” is a problem but can’t tell you which adversary campaign is lighting up, you don’t have a strategy dashboard. You have wall art.

I’ve been a fan of the MITRE ATT&CK framework for over a decade now. At a high level, it’s essentially an open-source intelligence report that captures the Tactics, Techniques, and Procedures (TTPs) of cyber adversary campaigns across the Intrusion Kill Chain. It is a structured knowledge base and taxonomy of observed adversary behavior built from public reporting and real-world observations. ATT&CK began with an APT-heavy focus, but today it tracks a broad set of publicly reported adversary activity clusters, including state-sponsored, criminal, and hybrid operations. It has become the industry’s de facto standard for representing and sharing adversary playbook intelligence.
This intelligence artifact, the framework, helps network defenders pursue their Threat-Led Defense prevention strategy. I called it something else in my book. I called it the Intrusion Kill Chain Prevention strategy.
In a previous essay (Source: The Kill Chain Rises from the Dead), I made the case that the number of unique adversary campaigns running on the internet on any given day is between 1,000 and 1,500. Unique, in this case, means that the sequence of intrusion kill chain steps is so different that it can’t be confused with another campaign’s sequence. Some campaigns use the same TTPs, sure, but in general, individual campaigns are singular.
What Does Threat-Led Defense Mean?
The main idea behind Threat-Led Defense (Intrusion Kill Chain Prevention) is to place obstacles in the way of every move that the adversary makes. To do that, network defenders deploy as many prevention controls as possible for every tool in their security stack and maps those controls to the campaign’s known TTPs. This strategy targets known adversary behavior specifically. That makes it a more active strategy, a more Spy vs Spy strategy, a strategy that engages with the adversary, like two boxers in a ring.
Contrast that to the Zero Trust strategy where network defenders deploy generic controls that might prevent any adversary from being successful. It’s passive, like putting a lock on your backyard fence gate to prevent thieves from getting in. You’re not reacting to what the bad guy is actually doing. You’re just ensuring that it’s not easy to break in. If you were reacting to what the bad guy was doing, you might grab a baseball bat from your daughter’s closet when you hear that noise in the middle of the night, head out to the backyard, and provide some disincentive for whomever is out there. That’s the difference. Threat-Led Defense is an active strategy and Zero Trust is passive.
How Do You Measure the Success of Your Threat-Led Defense Strategy?
Let’s say you’re an advocate of the Threat-Led Defense strategy and you have spent the last year deploying controls to your security stack toolset that map to the TTPs of the ATT&CK framework. How do you know how well you’re doing? Are any of your ATT&CK-mapped controls producing signal? It turns out that this is a far more complicated task than it sounds, really hard to deploy, and expensive to maintain. Here’s why.
If you’re a mid-sized to Fortune 500 company, the number of security stack tools that you manage is anywhere from 45 to 76 (Source: Organizations Now Have an Average 76 Security Tools to Manage). How do you know the configuration status of each of those tools in reference to the ATT&CK framework? A more pertinent question is this: are any of those ATT&CK-mapped controls actually seeing activity?
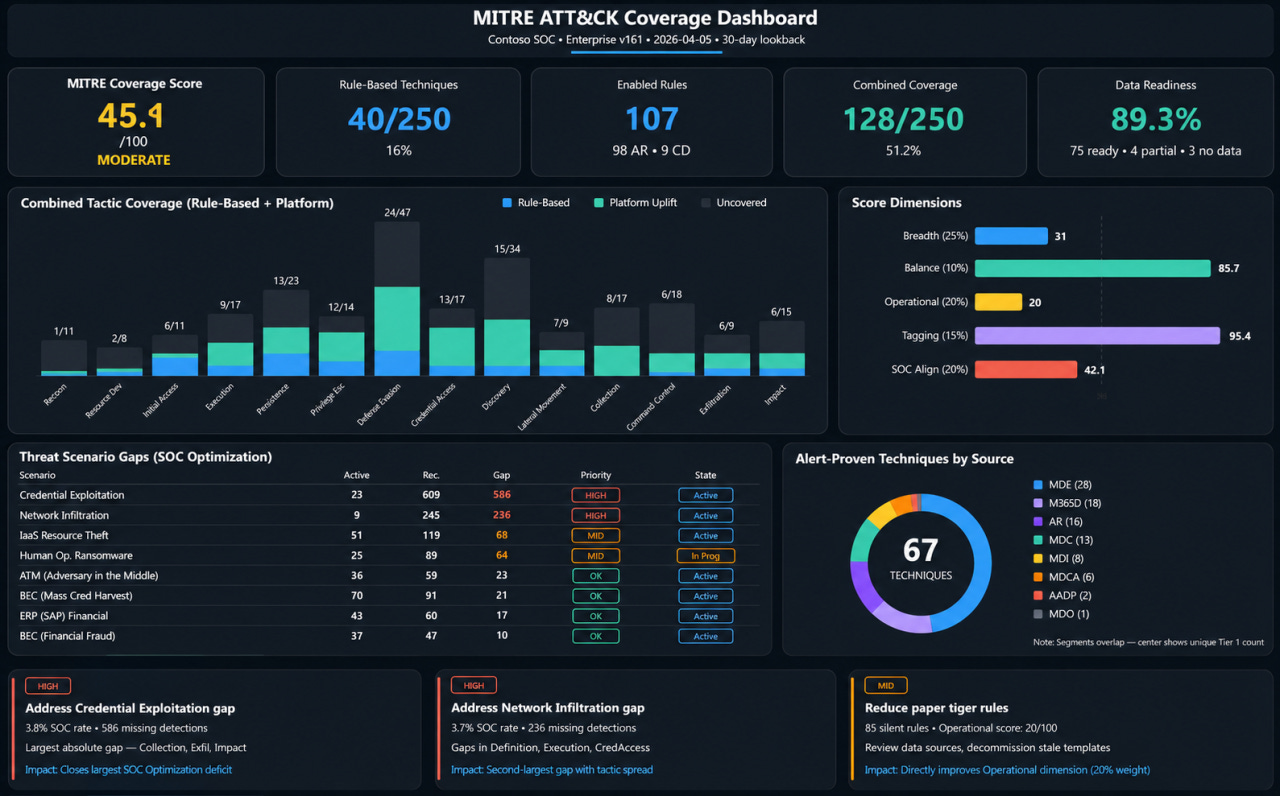
My colleague, María Luisa Redondo Velázquez (TK Elevator’s Global CISO), posted an essay on LinkedIn a couple of weeks ago about an open source effort to automate a dashboard for that very purpose. It’s called the MITRE ATT&CK Coverage Dashboard built by Chris Stelzer (Source: MITRE ATT&CK Coverage). It’s an automated, agentic workflow that produces a MITRE ATT&CK coverage assessment of your Microsoft Sentinel and Defender XDR environment in roughly 10 minutes, for about 15 cents in API costs.
It pulls categories of evidence from your environment like every ATT&CK-tagged analytic rule, every ATT&CK alert that fired in the last 30 days, the list of all Microsoft ATT&CK mappings from the Center for Threat-Informed Defense (CTID), and a bunch of other things in order to build the dashboard. The result if something like this:
So Close - But There Are Problems
This dashboard is enticing and it’s better than anything I’ve seen that tries to capture how protected you are in regard to MITRE ATT&CK. Particularly interesting to me is the “Combined Tactic Coverage (Rule-Based + Platform) section; a snapshot of how your Microsoft products are protecting your environment across the kill chain.
But there are problems with the chart too. Just in terms of “Chartology,” Chris uses a lot of colors and “scores” to indicate status but there is no explanation on the chart about what those colors or scores mean. If you’re an Edward Tufte fan, you will know what I mean.
More importantly, the chart doesn’t explain the nuance. For example, in the top-left-hand corner, the section called “MITRE Coverage Score,” the percentage in this example is only 45.1%. At first glance, that number might be alarmingly low. Contoso is only protected from 45% of the known ATT&CK Techniques. In reality, the Tactics and Techniques from the ATT&CK TTP triad aren’t normally granular enough to build a security control from. They are kind of high-order taxonomy categories. You typically don’t get the granularity you need to build a control until you collect the actual Procedures that the bad guys used in the campaign. A 45% score may or may not be good. Without knowing the denominator, the control quality, the enabled-vs-available distinction, and whether the mapped techniques matter to your threat model, the percentage is mostly decorative.
The last big problem with this chart is that it is focused on the wrong indicator: the Tactics and Techniques categories with no relation to any adversary campaign. For example, in the “Threat Scenario Gaps (SOC Optimization) section, you see “Credential Exploitation” counted 23 times. That sounds alarming, but is that 23 times from the same adversary campaign or is that 23 times from 23 different campaigns? The distinction matters.
What I Really Want to See
The first principle of the Threat-Led Defense strategy is not protecting yourself from every known TTP in MITRE ATT&CK with no relation to the adversary campaign. Achieving that is a tactical pursuit; a by-product of implementing the strategy. The first principle of the Threat-Led Defense strategy is deciding the probability that a specific adversary campaign is pointed at your environment.
For example, if Wicked Spider uses 100 total Procedures in its adversary campaign against Fortune 500 financials, and your security stack controls only fire on one of those Procedures, then the chances that Wicked Spider is in your network is small. But, if your security stack controls fire on 80 out of the 100 Procedures, then it’s likely that Wicked Spider is in your network.
What I want to see in my dashboard is simple. I want to see a matrix of adversary campaigns across the kill chain. In the first column, I want to list all 1500 adversary campaigns. In the second column, I want to list the number of security stack controls we have deployed against each adversary campaign and how many have fired in the last 30 days.
In the next 16 columns, I want to see ATT&CK’s kill chain phases (Recon, Resource Development, Delivery, Initial Access, Execution, Installation, Persistence, Privilege Escalation, Defense Evasion, Command and Control, Credential Access, Discovery, Lateral Movement, Collection, Exfiltration, and Impact), the number of controls we have deployed for each phase, and most importantly, how many controls have fired for each in the last 30 days. It should look something like this:
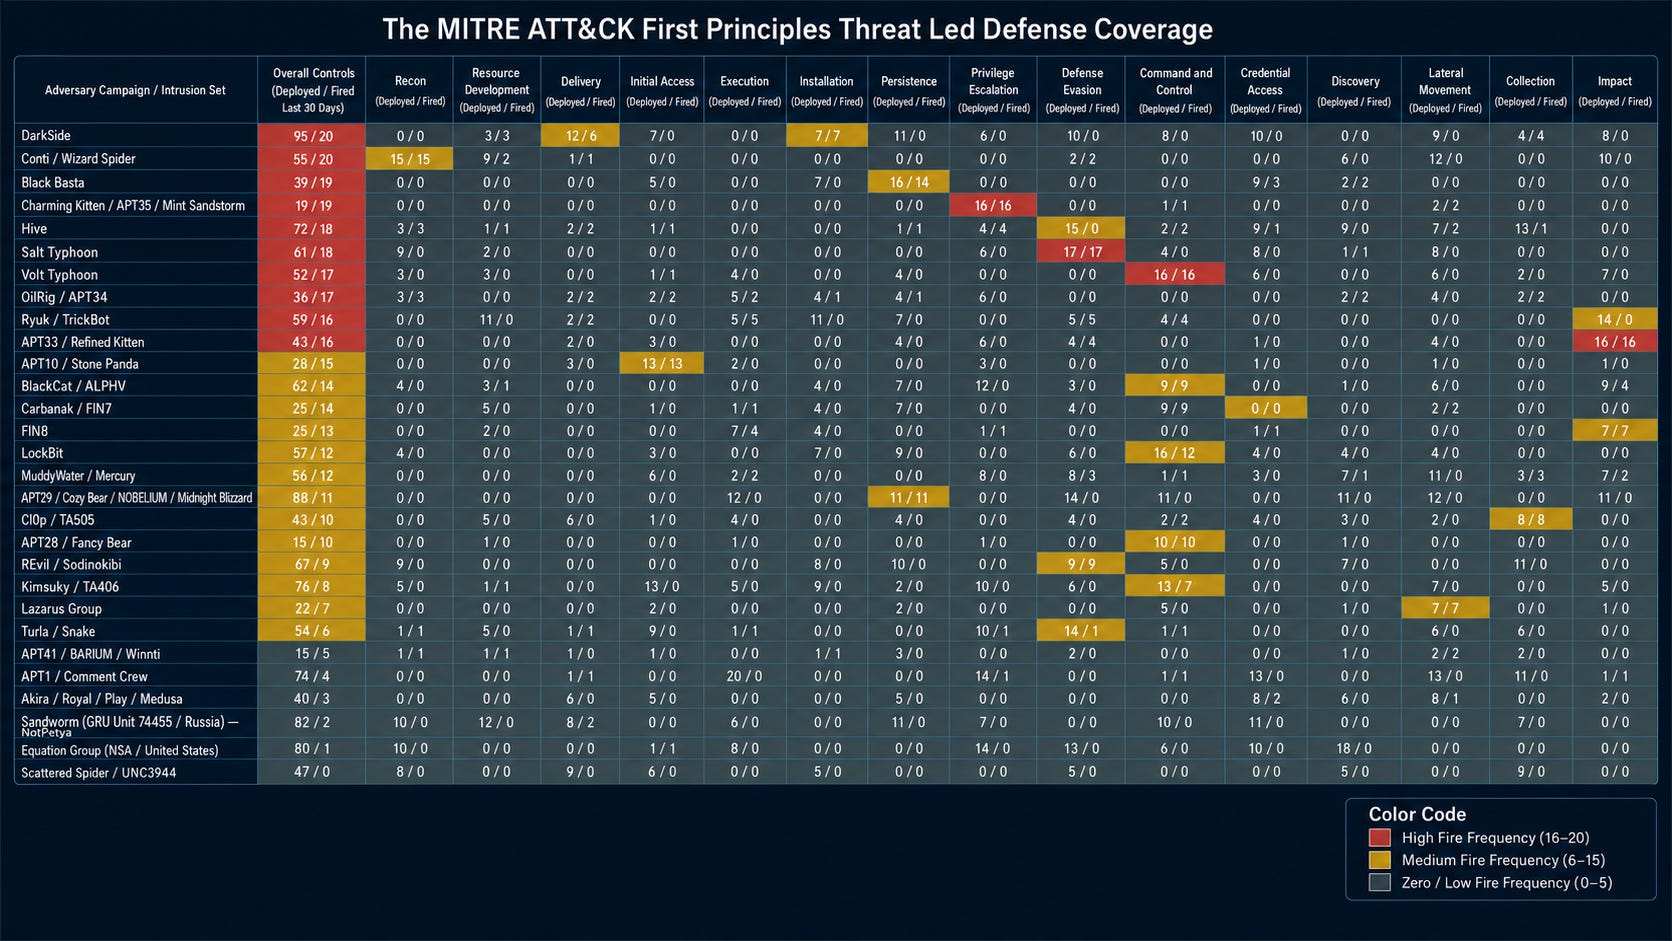
If you look at the Equation Group at the bottom of the chart, only one control has fired in the last 30 days. Whatever is going on there, it’s probably not the Equation Group.
By contrast, look at the DarkSide group at the top of the chart. 20 of our deployed controls have fired in the last 30 days. That’s a strong indicator that DarkSide is in our network. If that’s the case, it makes me wonder about the other 75 controls that aren’t firing. Either they are not very good controls to detect DarkSide activity or DarkSide has completely changed its attack campaign. Regardless, did I mention that DarkSide is in your network? It might be time to crank up the crisis response team.
Takeaway
ATT&CK coverage dashboards should move beyond aggregate tactic/technique coverage and support campaign-level investigative hypotheses: which adversary playbooks are we instrumented against, which procedure-level signals have fired recently, how unique are those signals, and what should the SOC investigate first?
MITRE ATT&CK coverage dashboards that measure the easy thing, how many TTPs your tools claim to cover, are useful. That’s not the same as knowing which adversary campaigns you are actually prepared to stop or which ones may already be knocking around your environment. The real question isn’t “What percentage of ATT&CK do we cover?” The real question is: “Which adversary playbooks are pointed at us, where are our controls deployed, and what evidence has fired recently?”
Source
María Luisa Redondo Velázquez, 2026. Measuring real MITRE ATT&CK coverage [Analysis]. LinkedIn, URL: https://www.linkedin.com/posts/marialuisaredondo_microsoftsecurity-defenderxdr-microsoftsentinel-share-7447744567044546560-v8Ub
Resources
Chris Stelzer, 2026. MITRE ATT&CK Coverage [Example Report]. SCStelz security-investigator - GitHub, URL: https://github.com/SCStelz/security-investigator/blob/main/reports/sentinel/mitre_coverage_example_report_2026040522_144021.md
Chris Stelzer, 2025. Security Investigation Automation System [Code Repository]. SCStelz security-investigator - GitHub, URL: https://github.com/SCStelz/security-investigator
Edward R. Tufte, 1990. Envisioning Information [Book]. Goodreads, URL: https://www.goodreads.com/book/show/17745.Envisioning_Information
Edward R. Tufte, 1997. Visual Explanations: Images and Quantities, Evidence and Narrative [Book]. Goodreads, URL: https://www.goodreads.com/book/show/17746.Visual_Explanations
Edward R. Tufte, 2006. Beautiful Evidence [Book]. Goodreads, URL: https://www.goodreads.com/book/show/17743.Beautiful_Evidence
Edward R. Tufte, 2020. Seeing with Fresh Eyes: Meaning, Space, Data, Truth [Book]. Goodreads, URL: https://www.goodreads.com/book/show/55610573-seeing-with-fresh-eyes
Phil Muncaster, 2021. Organizations Now Have an Average 76 Security Tools to Manage [Website Article]. Infosecurity Magazine, URL: https://www.infosecurity-magazine.com/news/organizations-76-security-tools/
Rick Howard, 2023. Cybersecurity First Principles: A Reboot of Strategy and Tactics [A 2026 Canon Hall of Fame Book]. Amazon. URL https://www.amazon.com/Cybersecurity-First-Principles-Strategy-Tactics-ebook/dp/B0C35HQFC3/ref=sr_1_1
Rick Howard, 2026. The Kill Chain Rises from the Dead [Explainer]. Rick’s First Principles Newsletter (Substack), URL: https://diffuser.substack.com/p/the-kill-chain-rises-from-the-dead
Rick Howard, 2025. The Next Evolution for the Intrusion Kill Chain Prevention Strategy [Explainer]. Rick’s First Principles Newsletter (Substack), URL: https://diffuser.substack.com/p/the-next-evolution-for-the-intrusion
Staff, 2026. Mappings Explorer [Platform Controls Wiki]. Center for Threat-Informed Defense, URL: https://center-for-threat-informed-defense.github.io/mappings-explorer/
Staff, 2026. Chris Stelzer Returns! Sentinel + XDR + MCP Server! (Episode 287) [Video]. The “AI” Security Insights Show - YouTube, URL:
Enjoyable as always Rick. Really appreciate your context. I’m convinced!